Not the bubbles. Not the crashes. The trajectory underneath them — with the same kind of law that governs how cities and living organisms grow.
wineLightning · July 2026 · draft v3 · built on Santostasi & Perrenod (2026)
And yet, hiding in plain sight, there is a pattern — you just need to look at the chart the way a physicist would.
① The chart everyone knows: a hockey stick. Fifteen years crushed into a corner. Unreadable.
② Make the price axis logarithmic — each gridline is ×10. Now you see waves… around something that keeps bending.
③ Make time logarithmic too — Bitcoin's age, in doublings. Watch the year ticks crowd to the right: time itself compresses. The bending stops. Sixteen years, six orders of magnitude — from cents to $100,000+ — one straight line.
P(t) ∝ t5.6 · R² = 0.96 (what that means: next slide)
A walk-forward test: the red line is fitted on 2010–2020 data only (navy); the orange years 2021–2026 are unseen by the fit, yet land within ~20% — through the 2021 mania, the 2022 collapse and the ETF era. Nor is this hindsight: public versions of this same line have existed since 2018 (Santostasi) and 2019 (the “power-law corridor”), and the price has kept landing on them. It is one law: the 2010–2020 fit (β = 5.68), the full-period fit (5.62) and the published 5.7 agree within the error bars. Even a skeptical 2026 statistics paper conceded it out-forecasts every fancier model at 1–2 year horizons.
R² measures how much of the variation the line explains: 0 is noise, 1 is perfect. The bottom panel is the leftover — price divided by the line: every mania and every crash is a ×3 wiggle that returns to 1. The cycles everyone trades are the residual; the line is the signal.
Maybe every asset does this, if you squint? We fitted the same power law to the others:
Sixteen years on one straight line is not a market regularity — it is an anomaly unique to Bitcoin. Whatever is doing this is doing it to exactly one asset on Earth. That is worth understanding.
The full comparison — Ethereum, Litecoin, gold, stocks, with the receipts — comes later in the deck.
price = A × ageβ
Age 2 → age 4: $1 → $50. Age 4 → age 8: $50 → $2,500. Age 8 → 16: $2,500 → $120,000. That's the last sixteen years, in one sentence.
10× bigger = 10× rarer (Gutenberg–Richter).
Rank-size law — Zipf. True in 1900 and today.
Mouse to whale, mass3/4 (Kleiber).
Word frequency in every tongue — Zipf again.
Fat tails — big ones predictably rare (Mandelbrot).
Casualty counts follow a power law (Richardson).
A few papers get almost all the cites (Price).
Links per page — scale-free (Barabási).
Burned area — self-organized criticality.
Energy released follows a power law too.
Fractal length at every scale (Mandelbrot).
Books, music, films — a few take most.
Sizes — the same impact process at every scale.
How a contagion sweeps a crowd — a power law of time. Remember this.
Pareto, 1896 — fortunes follow a power law. And this.
No central planner, no schedule — self-organizing systems with feedback, everywhere you look.
And the two highlighted cards are the entire recipe — hold that thought.
Power laws come in two kinds. On the left, a law of time — Bitcoin's price climbing at slope +5.6: the rare kind for a financial asset. On the right, a law of distribution — who has how much: human wealth, the Pareto law (1896, the “80/20 rule”): climb toward the richest and wealth rises as rank1/α (slope +0.83), anchored on the 59-millionth-richest person at ≈ $1M. Two straight lines, two unrelated worlds. Keep both in view. By the end, they'll turn out to be the same story — and a surprisingly simple one.
Among liquid financial assets, exactly one has a price power law in time: Bitcoin. Gold has the right general shape but data too noisy to qualify; stock indices grow roughly exponentially — a different curve family. One asset on Earth. That is what makes it extraordinary — and worth explaining.
Physicist Giovanni Santostasi spotted Bitcoin's power law years ago (he published it on Reddit in 2018, from data he had studied since ~2014), and spent the following years refining it — culminating in a 2026 paper with Stephen Perrenod: β ≈ 5.7, R² = 0.96, plus a first proposal for decomposing the exponent.
He also showed the price isn't alone: hash rate, addresses and price are all power laws of each other — a whole self-consistent system.
He tells the whole story in his book, The Physics of Bitcoin (2026) — “not an asset but a force of nature”.
A note on 5.7 vs 5.6: same law, different cutoff. They report ≈5.69; our refit through mid-2026 gives 5.62 ± 0.21 — identical within honest error bars (the exponent also depends on where you start the clock). We use ≈5.6 throughout; nothing hinges on the third digit.
But one question stayed open — the only one that really matters:
why ≈ 5.6?
All bodies fall the same way — he timed it precisely. But he could not say why the number was the number.
g = G·M / r²
fixed by two quantities outside the apple — the
Earth's mass M and radius r.
| GRAVITY · 1600s | BITCOIN · 2020s | |
|---|---|---|
| measure the law | Giovanni Riccioli (1651) — times gravity's constant | Giovanni Santostasi (2018) — measures β = 5.7 |
| split it in two | Giovanni Borelli (1666) — attraction × centrifugal: one right, one spurious | Santostasi & Perrenod (2026) — epidemic × “Metcalfe”: one right, one mislabeled |
| explain the why | Newton (1687) — g = G·M / r² | this work — β = βA × (1 + 1/α) |
This is brand-new science: Santostasi & Perrenod's decomposition was published in April 2026 — the field is moving in real time. Their whole thesis in one line: two power laws chained together, each doing a different job:
“Decomposing the exponent” just means: a power of a power multiplies. If holders grow as t³ and price grows as holders1.84, then price grows as t3 × 1.84 = t5.5.
β = βA × βM
→ 3 ×
1.84 ≈ 5.5
(measured directly: 5.6 — the ~2% gap is regression
noise, well inside the error bars)
one mystery number → two smaller ones, each needing its own
explanation
The same word, network, doing the work in both factors. If the network is what spreads the idea and what prices it, the explanation is circular — a red flag, not an answer. That itch is what started the whole investigation. The way out: follow what actually goes through a new adopter's head — it turns out to be two decisions, not one.
Here the network effect rules: more holders → more valuable, more liquid, more legitimate → I'm more likely to join. This is Metcalfe — and it's exactly what makes the idea spread (internet, smartphones, any network). It lives inside the 3 (βA).
A second, separate decision: what fraction of my wealth? Connection-count says nothing about this. It's governed by how much capital I command — this is βM.
Two decisions, two mechanisms. Metcalfe explains the first (adopt), wealth explains the second (how much). Putting the network in both factors counts it twice — once for spreading the idea, again for pricing it. Once Metcalfe is correctly parked inside the 3, βM is free to be what it really is: the size of the cheque each new believer writes.
Monetary theory agrees (Menger; Ammous): a money is first a store of value, then a medium of exchange, then a unit of account. Metcalfe prices the exchange stage; Bitcoin is winning the store-of-value stage — which is decision ②, an allocation of savings.
Bitcoin is caught by understanding, not by handshake — but the stages are an epidemic's, and every Bitcoiner has lived them:
Organizations go through the same stages — with committees: slower, but carrying far more capital.
The textbook case: public dismissal → conversion → becoming a super-spreader. Every bitcoiner recognizes the stages. The real question: is the pattern quantitative — does an idea-epidemic have a law?
Santostasi & Perrenod's explanation of the first factor: Bitcoin adoption behaves like an epidemic, and epidemic mathematics fixes its pace.
The result they build on — you will hear the name again — is Colgate (1989): Stirling Colgate, an astrophysicist modeling the early AIDS epidemic, showed that on real human networks — tight communities, loosely bridged — an epidemic does not explode exponentially. It has to grind its way from group to group, and the headcount grows as the cube of time, t³. Forty years old, replicated across diseases and networks since.
Their claim, then: Bitcoin adoption is such an epidemic, so its headcount should grow as t³. But why would a mental virus obey the same math as a biological one?
What sets the pace of an epidemic is the shape of the network it travels on, and beliefs travel on the same clustered human network as diseases: families, workplaces, cities, timelines.
*COVID subexponential t^2.1±0.3 via containment: Maier & Brockmann, Science 2020. Intrinsic polynomial spreading on clustered human networks: Colgate 1989 (AIDS, t³); Szendrői & Csányi 2004; Chowell 2016 (review). Communication: Leskovec–Adamic–Huberman 2007 (~linear cascades); Goel–Anderson–Watts 2016 (1B Twitter cascades); Bass 1969. Marketing — seeding, social proof, astroturfing — is applied epidemiology of belief.
Every fiat currency loses purchasing power by design. 21 million coins, forever — the first money whose supply cannot be expanded.
An asset no bank can freeze and no state can dilute. In much of the world, not theoretical.
No issuer, no border, no permission. The same rules for a student and a sovereign fund.
Declared dead 400+ times; survived bans, crashes, exchange failures. Each year alive lowers the trust barrier for the next adopter.
A small allocation with a large possible upside — a bet that fits every portfolio size.
The digital version always wins — photos, mail, maps. Bitcoin is gold's digital upgrade: same scarcity, sent in seconds, impossible to counterfeit.
ETFs, corporate treasuries, first states: each layer's entry makes belief easier for the next.
“The first global, private, digital, rules-based monetary system in the history of the world.” — Cathie Wood, ARK Invest
Rare, auditable, digital, decentralised, peer-to-peer, capped at 21 million — unlike infinitely printable money. — Yves Choueifaty, TOBAM (first regulated Bitcoin fund in Europe)
Different layers catch different strains — necessity in weak currencies, elegance for engineers, scarcity for investors. And here is why the argument doesn't matter: the theory does not require these beliefs to be true — only contagious. The math runs on transmission, not on truth.
Adoption of anything new follows the same curve — innovators, early adopters, majority, laggards (Rogers, 1962). What decides where you fall is susceptibility to a worldview change, and Bitcoin demands a big one: that money needn't be issued by a state. (Strictly, catching it is exposure × susceptibility: you can be perfectly susceptible and never have truly met the idea — or hear about it every day and stay immune. The epidemic needs both to line up; psychology governs the second.)
Across every stratum, susceptibility and wealth are independent axes. Psychology decides when you catch it; wealth decides how much you can bring. Keep that in your pocket — it becomes the key to the second number.
*Rogers diffusion; Granovetter threshold model; personality-cohort survey data. Illustrative, not load-bearing — the formula stands on the wealth exponent alone.
Left: cumulative US AIDS cases — Colgate's own subject — on four CDC-sourced points (1981–1988), a near-perfect straight line on log-log (R² = 0.995), growing as ≈ t³ — not exponentially. Right: Bitcoin's adopter count on the same axes — a first glimpse of the test to come. A biological contagion and a cognitive one, spreading on the same human network, obeying the same power law of time. The exponent shifts a little with the assumed epidemic start (~2.7–3.0) — the same time-origin sensitivity we're honest about for Bitcoin.
.com/.net registrations (Verisign) are a pure cognitive epidemic — no biology at all, just the idea of being online. Its adopter base grew as t³ (βA ≈ 3), on a completely different network, a decade and a half before Bitcoin existed. A physical virus, then a mind-virus — same number.
An astrophysicist models the AIDS epidemic and finds cases grow as t³, not exponentially — the network's clustered shape forces it. The origin of the number.
The marketing classic. New-product adoption is driven by a word-of-mouth coefficient q ≈ 0.3–0.5 — imitation, i.e. contagion. Fits TVs, dryers, phones at R²>0.9.
4 million people, a real referral network. Actual viral marketing grows ~linearly, not exponentially — the sub-exponential signature, measured in the wild.
A billion diffusion events on Twitter. Spread matches a low-infection contagion on a scale-free human network — the exact structure Colgate assumed.
Proves it's the topology, not the biology: clustering alone turns exponential growth into polynomial. Generalises Colgate to any clustered network.
Academic collaboration networks grow as t^2.3–3.1 — same class, zero money involved. Adoption power laws are a property of human networks themselves.
Biology, marketing, social media, pure math — every one of these lands sub-exponential: polynomial, never explosive. And the epidemics that run society-wide and can be measured end-to-end — AIDS (≈ t³), internet domains (≈ t³), the broadest collaboration networks (up to t^3.1) — keep landing at ≈ 3: a number intrinsic to the human network, physical or mind. Which sets up a hard prediction: if Bitcoin really is a society-wide cognitive epidemic, its adoption curve has no choice. It must read ≈ t³.
Three observables that share no data source: on-chain addresses holding bitcoin, cumulative views of the “Bitcoin” Wikipedia article, and cumulative worldwide Google searches for “bitcoin”. Awareness, curiosity, and action — all growing as ≈ t³ (slopes 3.0–3.6): the cube Colgate's mathematics predict.* *and reproduced by our network simulations.
Bam — 3. Three rulers, no shared data, one exponent: the number four decades of epidemiology said it had to be.
“Boring” but quietly profound: the 3 is really a measurement of the human social network itself — the clustered, scale-free shape of how we connect. Bitcoin's adoption curve is a ruler laid against the topology of humanity. Any spreading idea would read the same ruler — including the famous network effect: “I join because others are already there” is Metcalfe's force, and it is exactly what spreads the idea. Metcalfe lives here, inside the 3.
And so does the clock. The 3 now owns two things: the network — Metcalfe included — and all of the time-dependence. Whatever the 1.84 is, it cannot be the network again, and it cannot be time. Bitcoin has something special — and it lives in that 1.84.
*Szendrői & Csányi 2004, Chowell et al. 2016, Williams & Chen 2025, among others.
When the number of holders doubles, the price doesn't double — it multiplies by 3.6 (21.84).
Each new wave of adopters somehow moves the price more than proportionally. Who ordered the extra?
Notice what the 1.84 is not: there is no clock in it. A doubling of holders took months in 2011 and takes years today — yet each doubling multiplies the price by the same ×3.6. All of the time lives in the 3; the 1.84 is pure leverage per doubling. And for 3 × 1.84 to compose into one clean power law of time across six orders of magnitude, that leverage must be the same at every scale — the signature of another power law: not one in time, but a distribution. Which one?
Before the right answer — the wrong ones. We know they're wrong because we tried them ourselves.
*Holders = blockchain addresses holding a balance (~57M today); 1.84 is the fitted slope of price vs holders, both in log, over 2010–2026. It is measured on its own — not obtained by dividing 5.6 by 3 (which would give 1.87; the ~1.5% difference is fit noise between the three separate regressions). And yes: in expanding windows the two fitted components drift in opposite directions — we chased that (Tests 21/35/73) and it turned out to be regression mechanics plus the address-proxy aging, not physics: the product stays put, and the price-vs-holders line itself stays straight. The straight line is the claim.
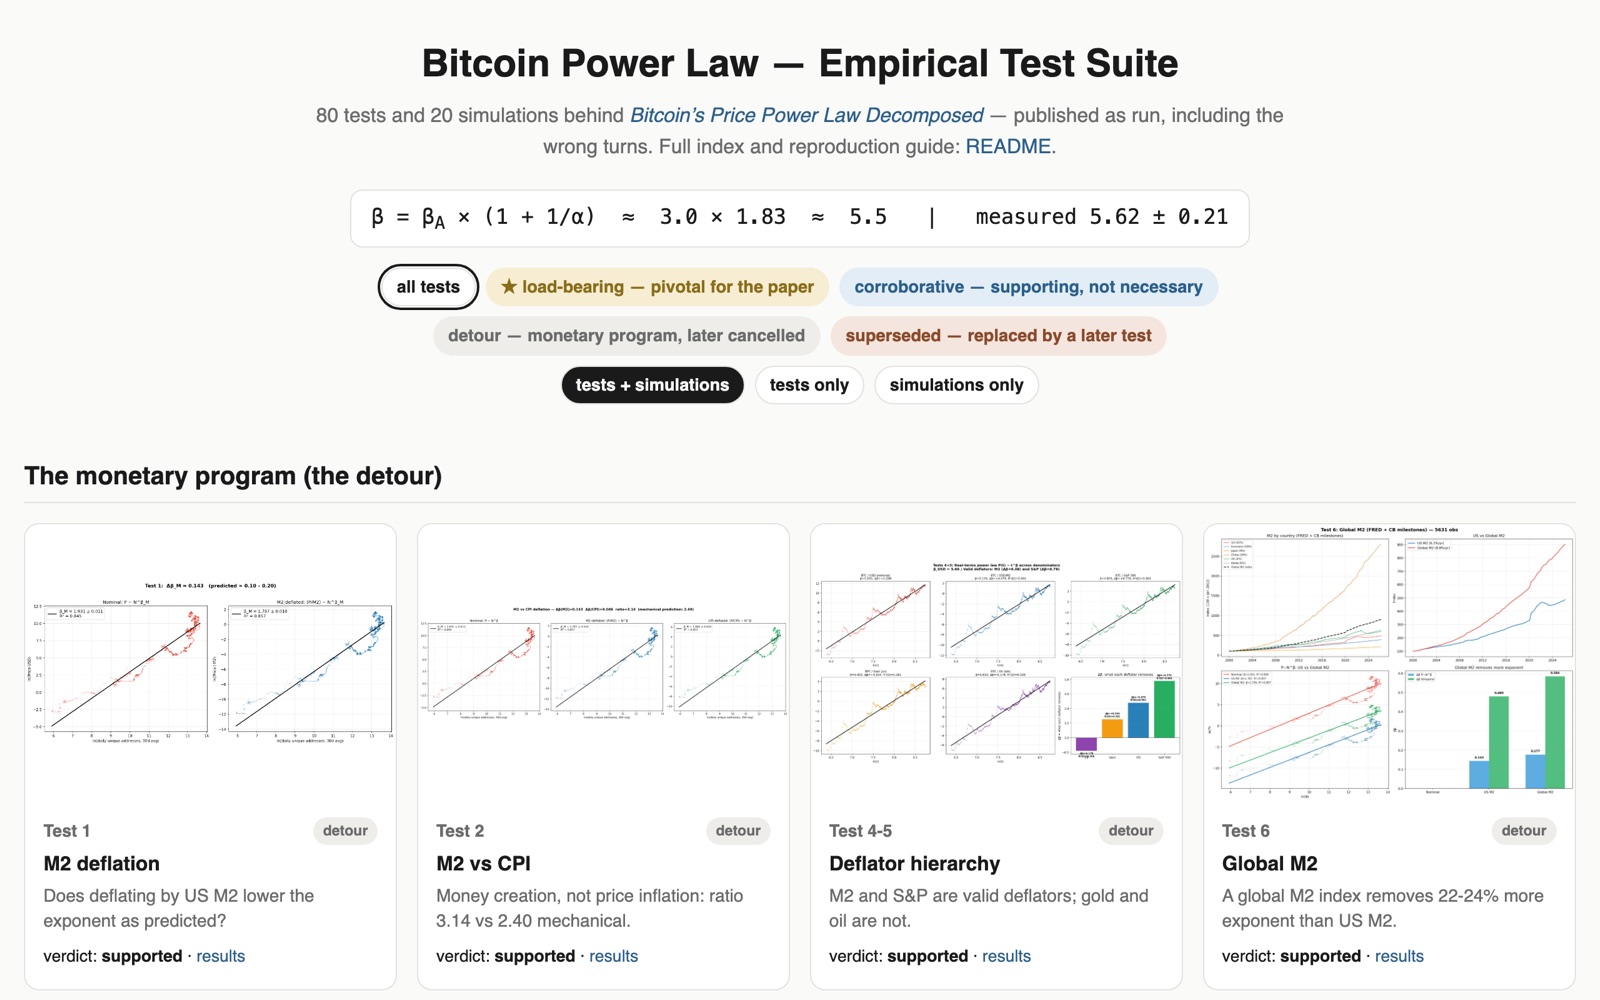
*In total: 79 tests, 20 simulations, and 24 documented dead ends — our full false-leads register is public.
Whatever explains 1.84 must explain this: the capital invested per holder has grown ×2,500 in 14 years — a clean power law of the number of holders. If adopters were arriving in random order, this line would be flat. Each wave of adoption arrives richer than the last.
Remember the second line we told you to hold onto? Vilfredo Pareto, 1896: human wealth follows a power law. The “80/20 rule” is its folk version. Its steepness is a single number, α — measured by economists for 130 years, on tax records and wealth reports, without ever looking at Bitcoin:
α ≈ 1.2
Bitcoin's idea-epidemic spreads through that pyramid: geeks → entrepreneurs → funds → BlackRock → states. Each wave taps proportionally deeper into it. And only 21 million coins exist — every richer wave must buy them from earlier holders, at whatever price releases them.
βM = 1 + 1/α = 1 + 1/1.2 ≈ 1.82
And the circularity is gone: the 3 lives in the network of minds (how fast the idea spreads); the 1.84 lives in the distribution of wallets (how much capital each wave carries). Two different objects — and the second is measured entirely outside Bitcoin.


Illustrative public milestones; sizes are the order of magnitude of wealth commanded by each new actor class (not capital allocated). Sixteen years, eight orders of magnitude: each wave reaches actors commanding ~10–100× more capital than the last — the geometric climb the formula needs. The order of arrival is the susceptibility story from the first factor; the size of each wave is the wealth pyramid.
While the first companies were putting bitcoin on their balance sheet, the individual wave was already ~7% in. Every heavier layer is still in its first movers — central banks hold 0% directly, though a few already own it indirectly (the Swiss National Bank holds MicroStrategy shares). And each layer buys its coins from the layers that moved earlier, at the price that makes them sell.
(a) What we measured, and how: plot Bitcoin's price against its number of holders — each dot is one day, 16 years — and fit a straight line. Its slope is βM = 1.83: every doubling of holders multiplies the price by 21.83 ≈ 3.6. (b) What it means: that slope (with honest ±0.09 error bars) lands in the green band that global wealth inequality predicts — computed with no Bitcoin data at all. Zipf is excluded; Metcalfe (2.0) is 1.9σ off and has no mechanism.
A real theory needs a control group. The premium requires BOTH ingredients — absolute scarcity and an epidemic still climbing the wealth pyramid. Ethereum lacks the cap; Litecoin's epidemic died among retail. Both premiums: zero. Bitcoin's: +0.84, the size the pyramid predicts. (And Litecoin has survived since 2011 — so mere survival creates no curve.)
The formula needs three things — a cognitive epidemic that climbs the wealth tiers, a fixed supply, and the wealth premium that follows. Line everything up:
| Asset | Cognitive epidemic? | Fixed supply? | Wealth premium 1/α? | Price power law? |
|---|---|---|---|---|
| Bitcoin | ✓ climbs tiers | ✓ 21M forever | ✓ +0.84 | ✓ β ≈ 5.6 |
| Ethereum | ✓ | ✗ variable issuance | ✗ ≈ 0 | weak (β ≈ 2.1) |
| Litecoin | ✓ but stalled in retail | ✓ 84M | ✗ ≈ 0 | ✗ (R² = 0.6) |
| Domain names (.com) | ✓ t³ | ✗ names unlimited | — | adoption only |
| Mobiles / smartphones | ~ huge contagion, no cognitive gate — adoption went exponential, not t³ (Test 79) | ✗ made to demand | — | ✗ |
| Apple / a Mag-7 stock | ✓ product | ✗ issues, splits | — | ✗ tracks earnings |
| S&P 500 / broad ETF | ✗ a basket | ✗ new shares | — | ✗ ~exponential |
| Gold | ✓ millennial | ~ mined slowly | weak | right shape, data noisy |
Bitcoin is the only row that ticks every box. Ethereum has the epidemic but no cap; Litecoin has the cap but its epidemic never climbed past retail; everything else lacks a fixed supply entirely. The theory isn't meant to fit Apple — and that it doesn't is the point.
One BlackRock address = millions of owners: the spot ETFs broke the visible headcount. The machinery reshuffled — from “more holders” to “same visible holders, double the capital each” — and the price stayed on the line. To be precise, this doesn't confirm the formula; it shows the law is structural, not an artifact of one growth channel — and the hand-over from headcount to capital-per-holder is exactly what a wealth-climbing wave does when it moves up a layer.
The formula survived every attack we could invent — and came out sharper. That is what we mean by “demonstrated”.
β = βA × (1 + 1/α)
epidemic speed × wealth inequality = 3.0 × 1.82 ≈ 5.5 · measured 5.62 ± 0.21
Bitcoin's price curve is the speed of an idea-epidemic, multiplied by the inequality of human wealth.
Nothing left to tune. One input is external to Bitcoin entirely — α ≈ 1.2, the wealth Pareto exponent from a century of economics. The other, βA ≈ 3, is measured three independent ways on Bitcoin's own adoption data (addresses, searches, Wikipedia) — and it lands where spreading on human networks lands (AIDS ~t³, internet domains ~t³). Once those two numbers are in, the formula has no freedom left: it had to give ≈ 5.5, and the market says 5.62 ± 0.21. It could have missed — so far it hasn't.
📄 Full paper & all 79 tests: e-xtend.com/btc_power_law
P(t) ∝ tβA·(1 + 1/α)
the whole law in one line — βA ≈ 3 (epidemic speed) · α ≈ 1.2 (wealth Pareto)
News, liquidations, sentiment. Genuinely unpredictable — and irrelevant to the law.
The halving cycles: bubbles and winters. Rhythmic, roughly anticipable, but they carry zero long-run trend of their own.
The power law. This is the layer this theory explains — and the one you can actually plan on.
Saturation of the epidemic, or a shift in the monetary regime itself. Slow, visible from far away.
Most market commentary is weather forecasting. Most “models” fit the seasons. This work is about the climate.
Research summary — not investment advice.
Nothing new is fitted here — it is the same line, extended: $1M around 2034 (2033–2036), $10M around 2047 (2045–2053). The ranges cover the honest error bars and the defensible choices of when to start the clock — note how the fan opens with distance. Read it as the corridor's centerline: cycles will overshoot and undershoot it, and the whole projection is conditional on the epidemic continuing to climb the layers (the runway slide). Watch it live: charts.bitbo.io/long-term-power-law.
wineLightning · 2026 · draft v2 — all figures regenerable from raw data with one script.